- Server Function: Server function execution logs with request/response data
- Authentication: User authentication and security logs
- PostgreSQL: Database queries, errors, and performance metrics
- Realtime: WebSocket connections and realtime subscriptions
- Storage: File uploads, downloads, and storage operations
- Cron Job: Scheduled job executions and cron task logs
- Server: HTTP requests and responses from Server Functions
- Function: Serverless function logs and events
- PostgREST: API requests to your database through PostgREST
- Supavisor: Connection pooling and database proxy logs
- PgBouncer: Legacy connection pooling logs
- Warehouse: Data warehouse operations and analytics
- PostgreSQL Upgrade: Database upgrade processes and migration logs
View database logs
To open the logs screen for your project’s database, follow these steps: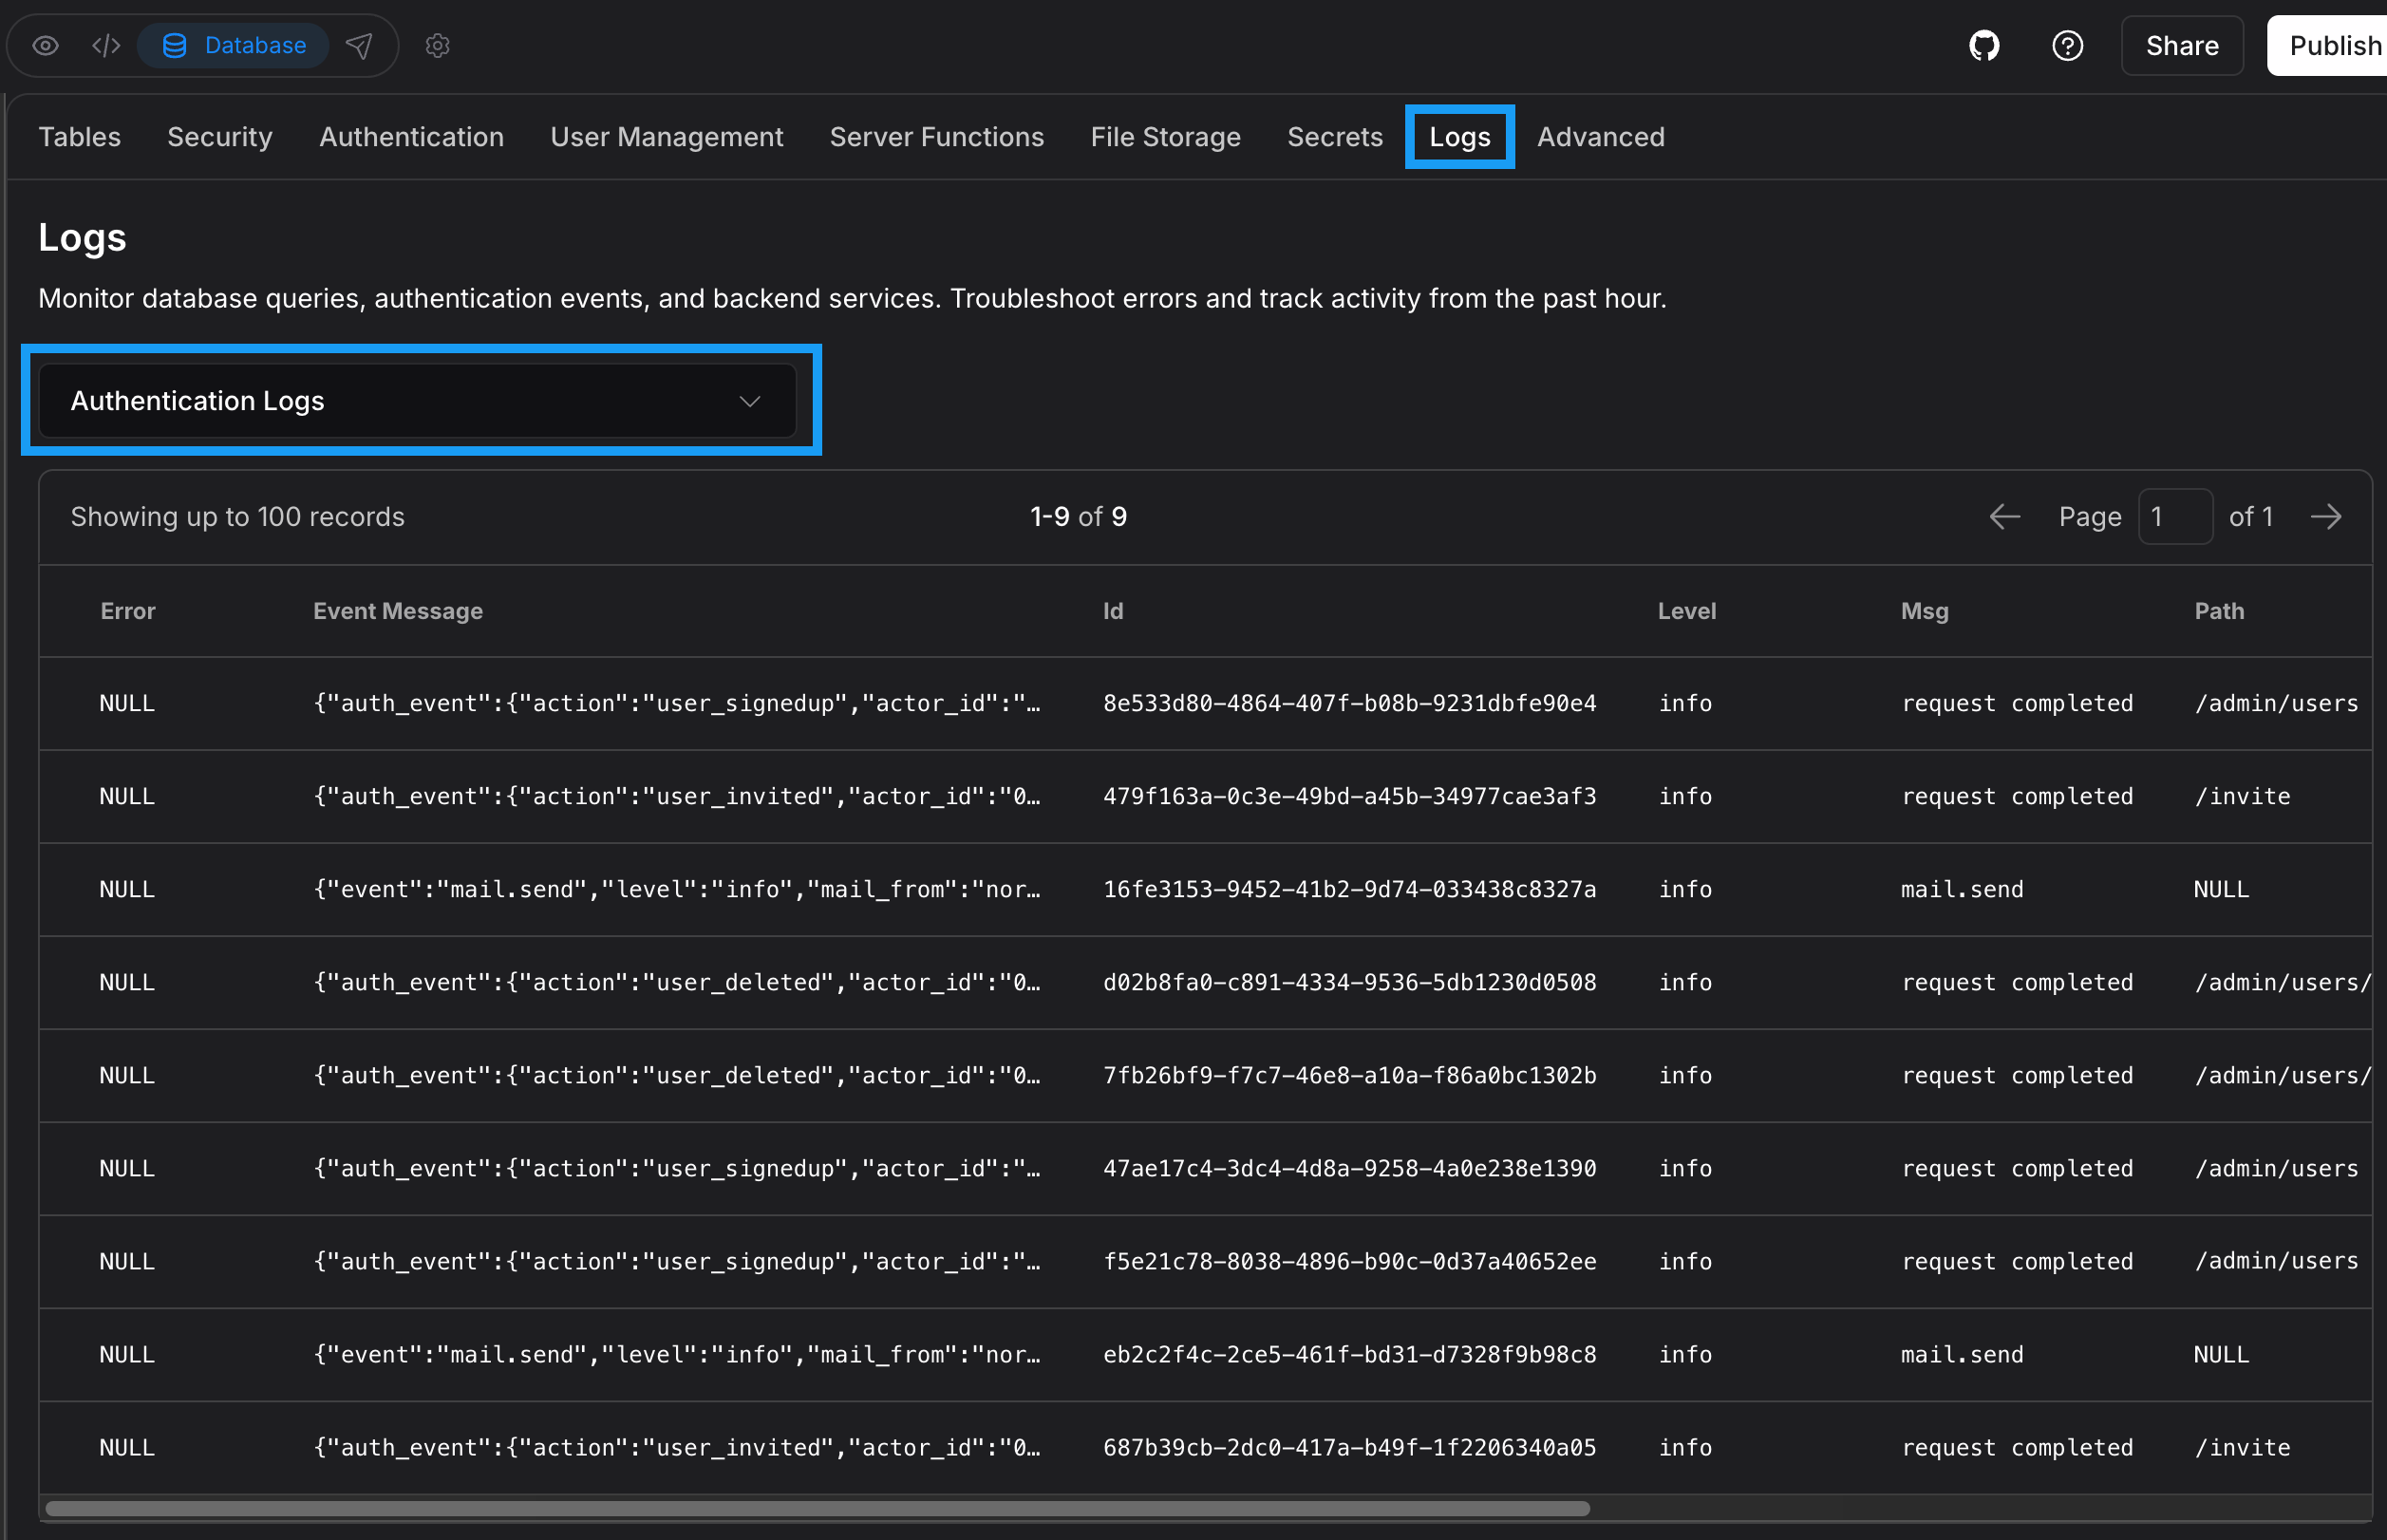
- Log in to your Bolt project.
- Click the database icon in the top center of your screen.
- Click Logs.
- In the dropdown, select the type of logs you want to view.